LG U+ builds happiness for shareholders, customers and staff
LG U+ offers various convenient services aimed at maximizing corporate values and considering both shareholders and customers.
Dividend Policy
LG U+ seeks to increase dividend payout ratio from a long-term perspective to enhance shareholder value and expand shareholder return.
Dividends are determined based on a balance between securing financial resources for long-term growth and returning to shareholders by comprehensively considering the business environment such as financial performance, cash flow etc.
In this respect, LG U+ announced its shareholder return policy for FY2024~FY2026 in 2024, as below.
[FY2024~FY2026 Shareholder Return Policy]
Total dividend payout will be determined by allocating at least 40% of the net income according to the
separate financial statements, excluding any one-time non-recurring profits. Furthermore, the company
commits to maintaining the annual cash dividends at a minimum level equal to the dividend per share paid
in fiscal year 2023.
By communicating with the market through this long-term dividend policy, LG U+ will strengthen sustainable management and improve the predictability of shareholder return.
Dividends are discussed in-depth at the board of directors, and the results are immediately communicated through a ‘Decision on Cash Dividend and Dividend in Kind.’ We are actively communicating with the market about the expected dividend outlook through the quarterly earnings results.
Dividend Status
| 구분 | 2023 |
|---|---|
| Par Value Per Share(KRW) | 5,000 |
| Net Income | 646,301 |
| Total Dividend | 279,388 |
| Payout Ratio(%) | 43% |
| Dividend Per Share(KRW) - Interim | 250 |
| Dividend Per Share(KRW) - Year-end | 400 |
| Market Price Dividend Ratio(%) | 6.2% |
| 구분 | 2022 |
|---|---|
| Par Value Per Share(KRW) | 5,000 |
| Net Income | 661,692 |
| Total Dividend | 279,388 |
| Payout Ratio(%) | 42% |
| Dividend Per Share(KRW) - Interim | 250 |
| Dividend Per Share(KRW) - Year-end | 400 |
| Market Price Dividend Ratio(%) | 5.5% |
| 구분 | 2021 |
|---|---|
| Par Value Per Share(KRW) | 5,000 |
| Net Income | 679,147 |
| Total Dividend | 237,566 |
| Payout Ratio(%) | 35% |
| Dividend Per Share(KRW) - Interim | 200 |
| Dividend Per Share(KRW) - Year-end | 350 |
| Market Price Dividend Ratio(%) | 3.7% |
| 구분 | 2020 |
|---|---|
| Par Value Per Share(KRW) | 5,000 |
| Net Income | 452,541 |
| Total Dividend | 196,475 |
| Payout Ratio(%) | 43% |
| Dividend Per Share(KRW) - Interim | - |
| Dividend Per Share(KRW) - Year-end | 450 |
| Market Price Dividend Ratio(%) | 3.7% |
| 구분 | 2019 |
|---|---|
| Par Value Per Share(KRW) | 5,000 |
| Net Income | 445,644 |
| Total Dividend | 174,645 |
| Payout Ratio(%) | 39% |
| Dividend Per Share(KRW) - Interim | - |
| Dividend Per Share(KRW) - Year-end | 400 |
| Market Price Dividend Ratio(%) | 2.8% |
Unit : KRW in millions
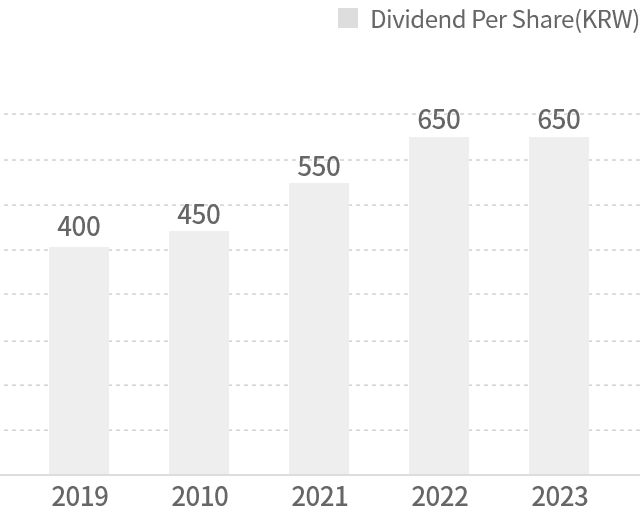
Dividend Per Share(KRW)
-
2019
- Dividend Per Share : 400
-
2020
- Dividend Per Share : 450
-
2021
- Dividend Per Share : 550
-
2022
- Dividend Per Share : 650
-
2023
- Dividend Per Share : 650